
NOTE: This is not a lab exercise. Rather this is reference guide to various tools that will be used in the lab exercises.
Attention: The descriptions of the commands in here are not complete. This document is given as a guideline and may be used as quick reference. To obtain more information about the capabilities and the syntax of these commands take a look at the man pages or simply use Wikipedia or Google .
Remark: Certain tools can be found in following directories: /usr/sbin, /usr/local/bin.
ping
The ping utility is used to check connectivity to a host (to check if a host operating and network connections are intact). A small packet is sent through the network to a particular IP address. This packet contains 64 bytes - 56 data bytes and 8 bytes of protocol header information. The host that sent the packet then waits (or 'listens') for a return packet. If the connections are good and the target host is up, a good return packet will be received. The ping can also measure the round trip time of a packet. We use the following forms of the command:
$ ping host
where host is the name or IP address of a host. It gives only the answer if the connectivity to the host is OK or not.
$ ping -s packetsize host
Option -s packetsize specifies the number of data bytes to be sent. The default is 56 Bytes (Linux).
$ ping -i interval host
Option -i interval specifies the interval between sending ping requests. The default is one second.
traceroute
The traceroute utility traces the route that an IP packet follows from your host to another Internet host. It shows how a host is physically connected to the Internet. Along the way it gives an understanding of how networks inter-connect. This network utility can also measure the round trip time between your host and the intermediate routers along the path.
The traceroute command is used to discover the routes that packets actually take when traveling to their destination. The device (for example, a router or a PC) sends out a sequence of User Datagram Protocol (UDP) datagrams to an invalid port address at the remote host. The default IP probe packet which encapsulates the UDP datagram is 40 bytes.
Three UDP datagrams are sent, each with a Time-To-Live (TTL) field value set to one. The TTL value of 1 causes the datagram to "timeout" as soon as it hits the first router in the path; this router then responds with an ICMP Time Exceeded Message (TEM) indicating that the datagram has expired.
Another three UDP messages are now sent, each with the TTL value set to 2, which causes the second router to return ICMP TEMs. This process continues until the packets actually reach the destination. Since these datagrams are trying to access an invalid port at the destination host, ICMP Port Unreachable Messages are returned, indicating an unreachable port; this event signals the Traceroute program that it is finished.
The purpose behind this is to record the source of each ICMP Time Exceeded Message to provide a trace of the path the packet took to reach the destination.
$ traceroute host
telnet (obsolete)
The telnet utility is used to connect from one host to another (remote login) via the internet network. This command allows you to log onto machines around the world that you have accounts on or that allow public access. The most common way to use the command is:
$ telnet host [port]
port indicates a port number (address of an application); if it is not specified, than the default telnet port is used.
After issuing the telnet command, you will be presented with a login prompt for the host system. You may now login to the host system. When you are finished with your remote session, logout as usual.
ssh
SSH is a set of standards and an associated network protocol that allows establishing a secure channel between a local and a remote computer. The SSH client - ssh - that supports terminal protocols is typically used for remote administration of the SSH server computer via terminal console, thus it is used as an alternative to telnet . The most common way to use the command is:
$ ssh -l username hostname
or
$ ssh username@hostname
After issuing the ssh command, if the remote computer authenticates you successfully, you will be presented with a login prompt for the remote machine. You may now login to the host system. When you are finished with your remote session, logout as usual.
ifconfig
The ifconfig utility is used to assign an address to a network interface and to configure or display the current network interface configuration information. It must be used at system startup to define the network address of each interface present on a machine. After system startup, it can also be used to redefine an interface's address and its other operating parameters. If a single interface argument is given, it displays the status of the given interface only; if a single -a argument is given, it displays the status of all interfaces. Otherwise, it configures an interface.
Note: the directory /sbin is not the path of a typical user. So you may have to type /sbin/ifconfig
netstat
The netstat utility allows to print the various data related to the network configuration of a station. Here, we show only two forms of this command:
Option -i allows to print the state of the network interfaces (e.g. eth0 or lo).
The MTU and Met fields show the current MTU and metric values for that interface. The RX and TX columns show how many packets have been received or transmitted error-free (RX-OK/TX-OK) or damaged (RX-ERR/TX-ERR); how many were dropped (RX-DRP/TX-DRP); and how many were lost because of an overrun (RX-OVR/TX-OVR).
The last column shows the flags that have been set for this interface. These characters are one-character versions of the long flag names that are printed when you display the interface configuration with ifconfig :
- B - A broadcast address has been set
- L - This interface is a loopback device
- M - All packets are received (promiscuous mode)
- O - ARP is turned off for this interface
- P - This is a point-to-point connection
- R - Interface is running
- U - Interface is up
When you invoke netstat with the -r flag, it displays the kernel routing table. The -n option makes netstat print addresses as dotted quad IP numbers rather than the symbolic host and network names. This option is especially useful when you want to avoid address lookups over the network (e.g., to a DNS or NIS server).
The second column of netstat 's output shows the gateway to which the routing entry points. If no gateway is used, an asterisk is printed instead. The third column shows the "generality" of the route, i.e., the network mask for this route. The fourth column displays the following flags that describe the route:
- G - The route uses a gateway
- U - The interface to be used is up
- H - Only a single host can be reached through the route
- D - This route is dynamically created. It is set if the table entry has been generated by a routing daemon like gated or by an ICMP redirect message
- M - This route is set if the table entry was modified by an ICMP redirect message
- ! - The route is a reject route and datagrams will be dropped
netperf
The netperf utility provides tests for both unidirectional throughput and end-to-end latency. The calculation of these parameters is based on measuring the time necessary to transmit messages of fixed size by TCP.
The most common use of netperf is measuring bulk data transfer performance. This is also referred to as "stream" or "unidirectional stream" performance. Essentially, these tests will measure how fast one system can send data to another and/or how fast that other system can receive it. Request/response performance is the second area that can be investigated with netperf . Generally speaking, netperf request/response performance is quoted as "transactions/s" for a given request and response size. A transaction is defined as the exchange of a single request and a single response. From a transaction rate, one can infer one way and round-trip average latency.
$ netperf host [message_size [count]]
The obligatorily parameter is the name or address of a destination towards which we want to measure the performance. The optional parameters are the size of the messages (in Bytes, by default 1024) and the number of messages to be sent (if the latter is not specified, netperf sends messages until you stop it by Ctrl-C).
netperf prints a statistics report regularly (approximately every second) in a table of 5 columns with the following heading:
Total Delta | Avg 1 Avg 10 Avg (kbits/s)
"Total" is the total number of messages sent since the launching of netperf; "Delta" is the number of messages sent since the preceding report/ratio; "Avg 1" is the average throughput since the preceding report; "Avg 10" is the average throughput during the last 10 reports; "Avg" is the average throughput since the launching of netperf. All the throughputs are expressed in Kbit/s.
nslookup, dig, host
The nslookup utility is used to find out the corresponding IP address of a host name (e.g., "whatis.com") by contacting Internet Domain Name Servers. It also does reverse name lookup and find the host name for a specified IP address. It has two modes: interactive and non-interactive. Interactive mode is used to get information about various hosts and domains or to displays a list of hosts in a domain. Non-interactive mode is used to display just the name and requested information for a host or domain.
Non-interactive mode:
$ nslookup host
Interactive mode:
$ nslookup
> server ns1.nic.fr
> set q=NS
> imag.fr.
Server: ns1.nic.fr
Address: 192.93.0.1
Non-authoritative answer:
imag.fr nameserver = dns.inria.fr
imag.fr nameserver = imag.imag.fr
imag.fr nameserver = isis.imag.fr
imag.fr nameserver = ns2.nic.fr
Authoritative answers can be found from:
dns.inria.fr internet address = 193.51.208.13
imag.imag.fr internet address = 129.88.30.1
isis.imag.fr internet address = 129.88.32.24
ns2.nic.fr internet address = 192.93.0.4
The dig command is similar to nslookup. It is a tool for querying DNS nameservers for information about host addresses, mail exchanges, nameservers, and related information. It performs DNS lookups and displays the answers that are returned from the name server(s) that were queried. As with nslookup, dig provides the possibility of inverse DNS queries through when the -x option is given.
Most DNS administrators use dig to troubleshoot DNS problems because of its flexibility, ease of use and clarity of output. Other lookup tools tend to have less functionality than dig.
Although dig is normally used with command-line arguments, it also has a batch mode of operation for reading lookup requests from a file. A brief summary of its command-line arguments and options is printed when the -h option is given. A further description may be found at the man page or here .
Below, you may also find a short description of the sections, which are returned by the dig command.
HEADER: This displays the dig command version number, the global options used by the dig command, and few additional header information.
QUESTION SECTION: This displays the question it asked the DNS. i.e This is one's input. If one has given the command dig WEBSITE, dig will indicate in this section the WEBSITE (e.g. cnn.com) that we asked for along with the type of the query. The default type dig command uses is "A record".
ANSWER SECTION: This displays the answer it receives from the DNS. i.e This is the output. For the default query type, this displays the "A record" of the WEBSITE (e.g. cnn.com).
AUTHORITY SECTION: This displays the DNS name server that has the authority to respond to this query. Basically this displays available name servers of the website.
ADDITIONAL SECTION: This displays the ip address of the name servers listed in the AUTHORITY SECTION. Stats section at the bottom displays few dig command statistics including how much time it took to execute this query.
Another useful command, but with lower functionality of both nslookup and dig is the host command. It is a simple utility for performing DNS lookups. It is normally used to convert names to IP addresses and vice versa. When no arguments or options are given, host prints a short summary of its command line arguments and options.
grep
The grep utility searches text files for a pattern and prints all lines that contain that pattern. If you want to search for a fixed string you should rather use fgrep . For example, to find which port protocol SMTP uses type the following:
$ fgrep smtp /etc/services
smtp 25/tcp mail
ssmtp 465/tcp # SMTP over SSL
Wireshark ( formerly known as Ethereal)
Wireshark is a free software protocol analyzer, or packet sniffer application, used for network troubleshooting, analysis, software and protocol development, and education. It has all of the standard features of a protocol analyzer. The functionality it provides is very similar to tcpdump , but it has a GUI front-end, and many more information sorting and filtering options. It allows the user to see all traffic being passed over the network by putting the network card into promiscuous mode. Moreover, it "understands" the structure of different network protocols and thus it's able to display encapsulation and single fields and interpret their meaning.
The basic tool for observing the messages exchanged between executing protocol entities is called a packet sniffer . As the name suggests, a packet sniffer captures (“sniffs”) messages being sent/received from/by your computer; it will also typically store and/or display the contents of the various protocol fields in these captured messages. A packet sniffer itself is passive. It observes messages being sent and received by applications and protocols running on your computer, but never sends packets itself. Similarly, received packets are never explicitly addressed to the packet sniffer. Instead, a packet sniffer receives a copy of packets that are sent/received from/by application and protocols executing on your machine.
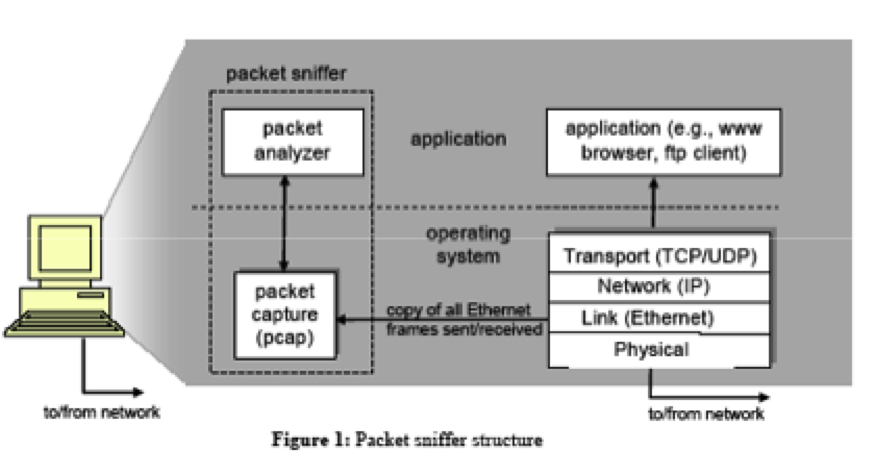
Figure 1 shows the structure of a packet sniffer. At the right of Figure 1 are the protocols (in this case, Internet protocols) and applications (such as a web browser or ftp client) that normally run on your computer. The packet sniffer, shown within the dashed rectangle in Figure 1 is an addition to the usual software in your computer, and consists of two parts. The packet capture library receives a copy of every link-layer frame that is sent from or received by your computer. Recall from the discussion from Section 1.5 in the textbook (Figure 1.20) that messages exchanged by higher layer protocols such as HTTP, FTP, TCP, UDP, DNS, or IP all are eventually encapsulated in link-layer frames that are transmitted over physical media such as an Ethernet cable. In Figure 1, the assumed physical media is an Ethernet, and so all higher layer protocols are eventually encapsulated within an Ethernet frame. Capturing all link-layer frames thus gives you all messages sent/received from/by all protocols and applications executing in your computer.
The second component of a packet sniffer is the packet analyzer , which displays the contents of all fields within a protocol message. In order to do so, the packet analyzer must “understand” the structure of all messages exchanged by protocols. For example, suppose we are interested in displaying the various fields in messages exchanged by the HTTP protocol in Figure 1. The packet analyzer understands the format of Ethernet frames, and so can identify the IP datagram within an Ethernet frame. It also understands the IP datagram format, so that it can extract the TCP segment within the IP datagram. Finally, it understands the TCP segment structure, so it can extract the HTTP message contained in the TCP segment. Finally, it understands the HTTP protocol and so, for example, knows that the first bytes of an HTTP message will contain the string “GET,” “POST,” or “HEAD,” as shown in Figure 2.8 in the text.
We will be using the Wireshark packet sniffer [ http://www.wireshark.org ] for these labs, allowing us to display the contents of messages being sent/received from/by protocols at different levels of the protocol stack. (Technically speaking, Wireshark is a packet analyzer that uses a packet capture library in your computer). Wireshark is a free network protocol analyzer that runs on Windows, Linux/Unix, and Mac computers. It’s an ideal packet analyzer for our labs – it is stable, has a large user base and well-documented support that includes a user-guide , man pages , and a detailed FAQ , rich functionality that includes the capability to analyze more than 500 protocols, and a well-designed user interface. It operates in computers using Ethernet, Token-Ring, FDDI, serial (PPP and SLIP), 802.11 wireless LANs and ATM connections (if the OS on which it’s running allows Wireshark to do so). Wireshark was previously known as “Ethereal”.
Running Wireshark
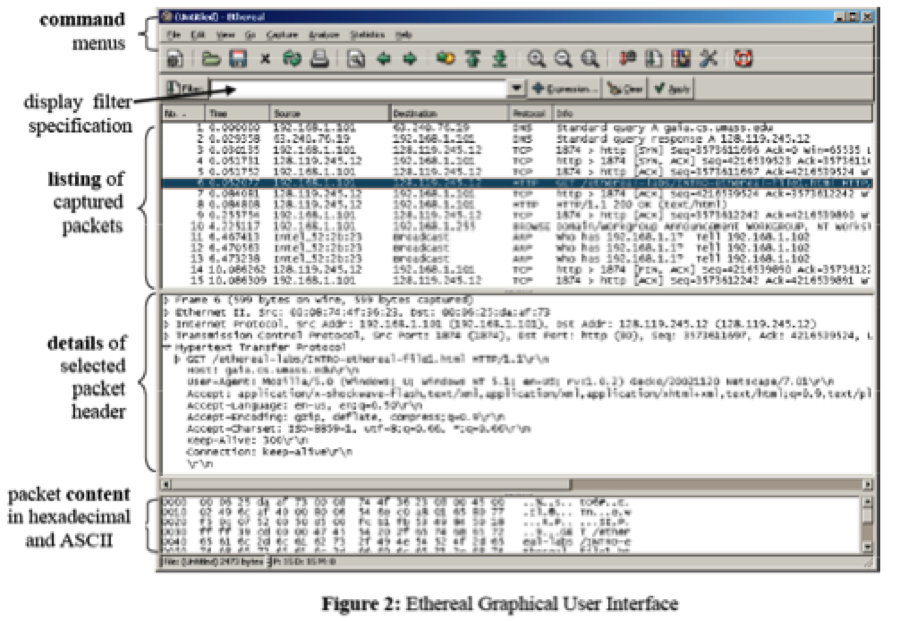
To run wireshark type “wireshark” at the command prompt (in case there is a problem with your path, type /usr/bin/wireshark). When you run the Wireshark program, the Wireshark graphical user interface shown in Figure 2 will de displayed. Initially, no data will be displayed in the various windows. The Wireshark interface has five major components:
- The command menus are standard pull down menus located at the top of the window. Of interest to us now are the File and Capture menus. The File menu allows you to save captured packet data or open a file containing previously captured packet data, and exit the Wireshark application. The Capture menu allows you to begin packet capture.
- The packet-listing window displays a one-line summary for each packet captured, including the packet number (assigned by Wireshark; this is not a packet number contained in any protocol’s header), the time at which the packet was captured, the packet’s source and destination addresses, the protocol type, and protocol-specific information contained in the packet. The packet listing can be sorted according to any of these categories by clicking on a column name. The protocol type field lists the highest-level protocol that sent or received this packet, i.e., the protocol that is the source or ultimate sink for this packet.
- The packet-header details window provides details about the packet selected (highlighted) in the packet-listing window. (To select a packet in the packet-listing window, place the cursor over the packet’s one-line summary in the packet-listing window and click with the left mouse button.). These details include information about the Ethernet frame and IP datagram that contains this packet. The amount of Ethernet and IP-layer detail displayed can be expanded or minimized by clicking on the right-pointing or down-pointing arrowhead to the left of the Ethernet frame or IP datagram line in the packet details window. If the packet has been carried over TCP or UDP, TCP or UDP details will also be displayed, which can similarly be expanded or minimized. Finally, details about the highest-level protocol that sent or received this packet are also provided.
- The packet-contents window displays the entire contents of the captured frame, in both ASCII and hexadecimal format.
- Towards the top of the Wireshark graphical user interface, is the packet display filter field , into which a protocol name or other information can be entered in order to filter the information displayed in the packet-listing window (and hence the packet-header and packet-contents windows). In the example below, we’ll use the packet-display filter field to have Wireshark hide (not display) packets except those that correspond to HTTP messages.
Resource created Saturday 04 September 2021, 10:47:44 AM, last modified Monday 20 September 2021, 08:51:52 PM.