Exercise 1: nslookup (Not Marked)
Question 1.
$ nslookup www.koala.com.au
Server:         129.94.242.2
Address:        129.94.242.2#53
Non-authoritative answer:
Name:    www.koala.com.au
Address: 104.18.60.21
Name:    www.koala.com.au
Address: 104.18.61.21
Websites may be replicated on multiple servers, with each
server running on a different end system, and each having a
different IP address. For replicated Web servers, a set of IP
addresses is thus associated with one canonical hostname. This
allows for load balancing: the DNS server replies to the DNS
requests with one of the listed IPs and the client thus
connects to one of them, but not always the same, so the load
isn't concentrated always on the same server.
Question 2.
$ nslookup 127.0.0.1
Server:         129.94.242.2
Address:        129.94.242.2#53
1.0.0.127.in-addr.arpa  name = localhost.
127.0.0.1 is the loopback address, also know as "localhost". The localhost refers to the internal interface used by the machine to send a packet to itself. It is non-routable IP address and refers to any computer that you happen to be sitting in front of now. When it sees "localhost", TCP/IP doesn't try to send information on the network, it sends it locally. localhost is often used for testing purpose.
Exercise 2: Use ping to test host reachability (2 marks)
The following hosts were reachable (at least when I tested with ping, your results may be different): www.unsw.edu.au , www.mit.edu , www.intel.com.au , www.tpg.com.au , www.tsinghua.edu.cn , www.amazon.com and 8.8.8.8
www.hola.hp and www.getfittest.com.au does not exist.
www.kremlin.ru was not reachable. This is because some organisations disable their network from replying to ICMP echo request packets which are used by ping. This is an often used security measure.
Note: You may try this from a different network (e.g. your home network) and check if you observe different behaviour.
Exercise 3: Use traceroute to understand network topology (4 marks)
Note: Your answers may vary from the provided solutions.
Question 1.
Here is the output of traceroute:
traceroute www.columbia.edu
traceroute to www.columbia.edu (128.59.105.24), 30 hops max, 60 byte packets
 1  cserouter1-server.cse.unsw.EDU.AU (129.94.242.251) 0.150 ms  0.128 ms  0.111 ms
 2  129.94.39.17 (129.94.39.17)  1.055 ms  1.077 ms  1.064 ms
 3  ombudnex1-vl-3154.gw.unsw.edu.au (149.171.253.35)  1.930 ms  1.924 ms libudnex1-vl-3154.gw.unsw.edu.au (149.171.253.34)  1.524 ms
 4  libcr1-po-5.gw.unsw.edu.au (149.171.255.165)  1.200 ms ombcr1-po-6.gw.unsw.edu.au (149.171.255.169)  1.312 ms ombcr1-po-5.gw.unsw.edu.au (149.171.255.197)  1.241 ms
 5  unswbr1-te-2-13.gw.unsw.edu.au (149.171.255.105)  1.332 ms unswbr1-te-1-9.gw.unsw.edu.au (149.171.255.101)  1.445 ms unswbr1-te-2-13.gw.unsw.edu.au (149.171.255.105)  1.356 ms
 6  138.44.5.0 (138.44.5.0)  1.542 ms  1.356 ms  1.413 ms
 7  et-1-3-0.pe1.sxt.bkvl.nsw.aarnet.net.au (113.197.15.149)  2.251 ms  2.249 ms  2.520 ms
 8  et-0-0-0.pe1.a.hnl.aarnet.net.au (113.197.15.99)  95.395 ms  95.327 ms  95.260 ms
 9  et-2-1-0.bdr1.a.sea.aarnet.net.au (113.197.15.201)  146.481 ms  146.474 ms  146.427 ms
10  abilene-1-lo-jmb-706.sttlwa.pacificwave.net (207.231.240.8)  153.531 ms  153.515 ms  153.545 ms
11  et-4-0-0.4079.rtsw.miss2.net.internet2.edu (162.252.70.0)  157.525 ms  157.534 ms  157.621 ms
12  et-4-0-0.4079.rtsw.minn.net.internet2.edu (162.252.70.58)  180.583 ms  180.789 ms  180.527 ms
13  et-1-1-2.4079.rtsw.eqch.net.internet2.edu (162.252.70.106)  188.725 ms  188.623 ms  188.668 ms
14  ae-1.4079.rtsw.clev.net.internet2.edu (162.252.70.130)  200.499 ms  196.958 ms  196.954 ms
15  buf-9208-I2-CLEV.nysernet.net (199.109.11.33)  201.236 ms  201.391 ms  201.357 ms
16  syr-9208-buf-9208.nysernet.net (199.109.7.193)  205.224 ms  205.256 ms  205.248 ms
17  nyc-9208-syr-9208.nysernet.net (199.109.7.162)  210.422 ms  210.484 ms  210.497 ms
18  columbia.nyc-9208.nysernet.net (199.109.4.14)  210.439 ms  210.404 ms  210.527 ms
19  cc-core-1-x-nyser32-gw-1.net.columbia.edu (128.59.255.5)  244.072 ms  244.069 ms  210.738 ms
20  cc-conc-1-x-cc-core-1.net.columbia.edu (128.59.255.210)  211.049 ms  210.983 ms  211.088 ms
21  columbia.university (128.59.105.24)  210.793 ms  210.847 ms  210.699 ms
The output shows that there are 20 routers ( 21 hops, in last hop we have reached the webserver) between my machine and the columbia web server.
The first five routers appear to be part of the UNSW networks based on their hostnames. A reverse DNS query on the 6th hop router (138.44.5.0) reveals the following
dig -x 138.44.5.0
; <<>> DiG 9.7.3 <<>> -x 138.44.5.0
;; global options: +cmd
;; Got answer:
;; ->>HEADER<<- opcode: QUERY, status: NXDOMAIN, id: 57378
;; flags: qr rd ra; QUERY: 1, ANSWER: 0, AUTHORITY: 1, ADDITIONAL: 0
;; QUESTION SECTION:
;0.5.44.138.in-addr.arpa.    IN    PTR
;; AUTHORITY SECTION:
5.44.138.in-addr.arpa.    3070    IN    SOA    ns1.aarnet.net.au. hostmaster.aarnet.edu.au. 2017121506 10800 600 1209600 3600
;; Query time: 4 msec
;; SERVER: 129.94.242.2#53(129.94.242.2)
;; WHEN: Thu Jul 19 10:19:57 2018
;; MSG SIZE  rcvd: 116
This suggests that this router is part of the AARNET domain. Hence, the answer to the question would be the first 5 routers are part of the UNSW network.
There is a big difference in the RTTs to the following routers at hop 7-8 and 8-9.
7  et-1-3-0.pe1.sxt.bkvl.nsw.aarnet.net.au (113.197.15.149)  2.251 ms  2.249 ms  2.520 ms
 8  et-0-0-0.pe1.a.hnl.aarnet.net.au (113.197.15.99)  95.395 ms  95.327 ms  95.260 ms
 9  et-2-1-0.bdr1.a.sea.aarnet.net.au (113.197.15.201)  146.481 ms  146.474 ms  146.427 ms
10  abilene-1-lo-jmb-706.sttlwa.pacificwave.net (207.231.240.8)  153.531 ms  153.515 ms  153.545 ms
This suggests that this is where the path crosses the Pacific Ocean. It is interesting to note that the 8th and 9th hop routers are still part of the AARNET network. However, examining the AARNET topology map suggests that these are very likely part of the AARNET PoP (Point of Presence) that are physically located in Honolulu and Seattle (note hostnames have 'hnl' and 'sea'). The 10th hop router (207.231.240.8) is part of the pacificwave network (AARNET equivalent in the US Pacific West) and seems to be located also in Seattle.
Note that the path your trace route takes may vary, but you should be able to identify all relevant routers along the path.
Question 2.
Here are the outputs for the 3 destinations (omitting the non-responsive routers):
$ traceroute www.ucla.edu
traceroute to www.ucla.edu (164.67.228.152), 30 hops max, 40 byte packets
 1 vlan385.gaszr1.gw.unsw.EDU.AU (129.94.242.1) 1.221 ms 1.246 ms 1.660 ms
 2 129.94.6.122 (129.94.6.122) 0.461 ms 0.460 ms 0.451 ms
 3 129.94.39.17 (129.94.39.17) 1.608 ms 1.598 ms 1.574 ms
 4 ombudnex1-vl-3154.gw.unsw.edu.au (149.171.253.35) 2.339 ms 1.790 ms 2.310 ms
 5 libcr1-po-5.gw.unsw.edu.au (149.171.255.165) 1.541 ms 1.532 ms libcr1-po-6.gw.unsw.edu.au (149.171.255.201) 1.526 ms
 6 unswbr1-te-8-1.gw.unsw.edu.au (149.171.255.105) 1.512 ms 1.426 ms unswbr1-te-7-1.gw.unsw.edu.au (149.171.255.101) 1.443 ms
 7 138.44.5.0 (138.44.5.0) 1.599 ms 1.757 ms 1.728 ms
 8 et-1-1-0.pe2.brwy.nsw.aarnet.net.au (113.197.15.19) 2.417 ms 2.411 ms 2.398 ms
 9 et-0-0-0.pe1.a.hnl.aarnet.net.au (113.197.15.99) 95.419 ms 95.420 ms 95.413 ms
10 et-1-0-0.bb1.a.sea.aarnet.net.au (202.158.194.110) 146.838 ms 146.837 ms 146.569 ms
11 cenichpr-1-is-jmb-778.snvaca.pacificwave.net (207.231.245.129) 163.456 ms 163.626 ms 163.804 ms
12 lax-hpr3--svl-hpr2-10g.cenic.net (137.164.25.37) 171.287 ms 171.732 ms 171.726 ms
13 * * *
14 bd11f1.anderson--cr01f1.anderson.ucla.net (169.232.4.6) 238.122 ms 240.359 ms 240.336 ms
15 cr01f1.anderson--dr01f2.csb1.ucla.net (169.232.4.55) 173.627 ms cr01f2.csb1--dr01f2.csb1.ucla.net (169.232.4.53) 172.142 ms cr01f1.anderson--dr01f2.csb1.ucla.net (169.232.4.55) 172.120 ms
$ traceroute www.u-tokyo.ac.jp
traceroute to www.u-tokyo.ac.jp (210.152.135.178), 30 hops max, 40 byte packets
 1 vlan385.gaszr1.gw.unsw.EDU.AU (129.94.242.1) 2.861 ms 3.046 ms 3.218 ms
 2 129.94.6.122 (129.94.6.122) 0.893 ms 1.052 ms 1.049 ms
 3 129.94.39.17 (129.94.39.17) 2.006 ms 2.001 ms 1.989 ms
 4 ombudnex1-vl-3154.gw.unsw.edu.au (149.171.253.35) 2.942 ms 2.926 ms 2.923 ms
 5 libcr1-po-5.gw.unsw.edu.au (149.171.255.165) 2.114 ms 2.102 ms ombcr1-po-5.gw.unsw.edu.au (149.171.255.197) 2.098 ms
 6 unswbr1-te-7-1.gw.unsw.edu.au (149.171.255.101) 2.094 ms unswbr1-te-8-1.gw.unsw.edu.au (149.171.255.105) 1.489 ms 2.296 ms
 7 138.44.5.0 (138.44.5.0) 2.543 ms 1.671 ms 1.662 ms
 8 et-1-1-0.pe1.rsby.nsw.aarnet.net.au (113.197.15.12) 1.944 ms 1.844 ms 2.030 ms
 9 ae5.pe1.msct.nsw.aarnet.net.au (113.197.15.63) 2.021 ms 2.020 ms 1.857 ms
10 xe-0-0-3.pe1.wnpa.akl.aarnet.net.au (113.197.15.67) 24.755 ms 24.583 ms 24.572 ms
11 et-0-1-0.200.pe1.tkpa.akl.aarnet.net.au (113.197.15.69) 24.571 ms 24.516 ms 26.926 ms
12 xe-1-0-0.bb1.a.lax.aarnet.net.au (202.158.194.173) 149.891 ms 149.866 ms 151.349 ms
13 xe-1-0-0.bb1-a-pao.aarnet.net.au (202.158.194.171) 159.903 ms 159.902 ms 159.893 ms
14 paloalto0.iij.net (198.32.176.24) 161.757 ms 161.957 ms 161.930 ms
15 osk004bb01.IIJ.Net (58.138.88.189) 274.912 ms 273.907 ms 273.892 ms
16 osk004ix51.IIJ.Net (58.138.107.222) 271.731 ms osk004ix51.IIJ.Net (58.138.107.214) 271.398 ms osk004ix51.IIJ.Net (58.138.107.170) 271.337 ms
17 210.130.135.130 (210.130.135.130) 271.306 ms 273.217 ms 271.262 ms
18 124.83.252.250 (124.83.252.250) 277.530 ms 275.385 ms 277.503 ms
19 114.111.64.197 (114.111.64.197) 279.036 ms 278.160 ms 280.306 ms
20 ae1.fk1cr01.idc.jp (158.205.134.22) 278.062 ms 276.222 ms 276.302 ms
21 po2.l321.fk1.eg.idc.jp (158.205.121.250) 276.287 ms 278.676 ms 278.488 ms
$ traceroute www.lancaster.ac.uk
traceroute to www.lancaster.ac.uk (148.88.2.80), 30 hops max, 40 byte packets
 1 vlan385.gaszr1.gw.unsw.EDU.AU (129.94.242.1) 0.992 ms 1.140 ms 1.351 ms
 2 129.94.6.122 (129.94.6.122) 0.349 ms 0.346 ms 0.340 ms
 3 129.94.39.17 (129.94.39.17) 1.199 ms 1.164 ms 1.200 ms
 4 ombudnex1-vl-3154.gw.unsw.edu.au (149.171.253.35) 1.927 ms libudnex1-vl-3154.gw.unsw.edu.au (149.171.253.34) 9.591 ms ombudnex1-vl-3154.gw.unsw.edu.au (149.171.253.35) 1.969 ms
 5 ombcr1-po-5.gw.unsw.edu.au (149.171.255.197) 1.330 ms ombcr1-po-6.gw.unsw.edu.au (149.171.255.169) 1.304 ms 1.329 ms
 6 unswbr1-te-8-1.gw.unsw.edu.au (149.171.255.105) 1.306 ms 1.312 ms 1.344 ms
 7 138.44.5.0 (138.44.5.0) 1.561 ms 1.404 ms 1.284 ms
 8 et-1-1-0.pe1.rsby.nsw.aarnet.net.au (113.197.15.12) 1.559 ms 1.565 ms 1.585 ms
 9 et-1-1-0.pe1.msct.nsw.aarnet.net.au (113.197.15.15) 2.066 ms 1.806 ms 1.948 ms
10 et-1-3-0-199.pe2.brwy.nsw.aarnet.net.au (113.197.15.78) 1.903 ms 1.958 ms 1.905 ms
11 et-0-0-0.pe1.a.hnl.aarnet.net.au (113.197.15.99) 95.336 ms 95.323 ms 95.492 ms
12 et-1-0-0.bb1.a.sea.aarnet.net.au (202.158.194.110) 146.812 ms 146.808 ms 146.796 ms
13 abilene-1-is-jmb-776.lsanca.pacificwave.net (207.231.241.131) 171.377 ms 171.361 ms 171.365 ms
14 et-1-0-0.111.rtr.hous.net.internet2.edu (198.71.45.20) 203.739 ms 203.594 ms 205.076 ms
15 et-10-0-0.105.rtr.atla.net.internet2.edu (198.71.45.12) 229.026 ms 229.014 ms 229.775 ms
16 et-9-0-0.104.rtr.wash.net.internet2.edu (198.71.45.7) 240.363 ms 241.068 ms 241.692 ms
17 internet2-gw.mx1.lon.uk.geant.net (62.40.124.44) 314.868 ms 315.217 ms 315.235 ms
18 janet-gw.mx1.lon.uk.geant.net (62.40.124.198) 315.206 ms 335.104 ms 335.095 ms
19 ae29.londpg-sbr1.ja.net (146.97.33.2) 384.433 ms 315.533 ms 315.528 ms
20 ae31.erdiss-sbr1.ja.net (146.97.33.22) 319.458 ms 319.434 ms 319.446 ms
21 ae29.manckh-sbr1.ja.net (146.97.33.42) 321.105 ms 321.288 ms 332.221 ms
22 cnl.manckh-sbr1.ja.net (146.97.41.54) 323.558 ms 323.548 ms 323.528 ms
23 * * *
24 ismx-issrx.rtr.lancs.ac.uk (148.88.255.17) 324.949 ms 324.934 ms 325.255 ms
25 dc.iss.srv.rtrcloud.lancs.ac.uk (148.88.253.3) 338.104 ms 338.108 ms 338.103 ms
The first 7 hops are identical on all 3 paths. The 3 paths differ in the next hop following the 138.44.5.0 router. Notice that the Tokyo and Lancaster paths also have a common 8th hop router (113.197.15.12). For all 3 paths, this 8th router belongs to the AARNET network.
No, the number of hops is clearly not proportional to the physical distance. The path to Tokyo (which is closer to Sydney as compared to LA) takes about 21 hops while that to Los Angeles is only 15 hops.
Question 3.
IP address of my machine: 129.94.8.24, IP address of www.telstra.net : 203.50.5.178
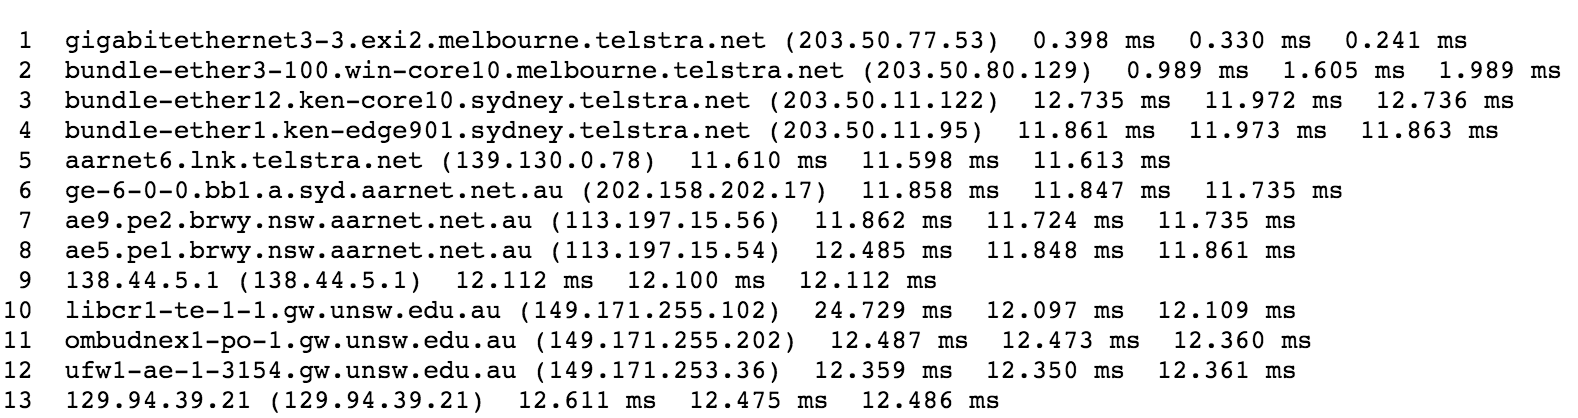
Traceroute from Telstra to my machine:
Traceroute from my machine to Telstra:
1 vlan385.gaszr1.gw.unsw.EDU.AU (129.94.242.1) 1.012 ms 1.155 ms 1.373 ms
 2 129.94.6.122 (129.94.6.122) 0.366 ms 0.365 ms 0.356 ms
 3 129.94.39.17 (129.94.39.17) 1.116 ms 1.119 ms 1.080 ms
 4 libudnex1-vl-3154.gw.unsw.edu.au (149.171.253.34) 1.723 ms 1.674 ms 1.657 ms
 5 libcr1-po-6.gw.unsw.edu.au (149.171.255.201) 1.338 ms 1.357 ms 1.238 ms
 6 unswbr1-te-7-1.gw.unsw.edu.au (149.171.255.101) 1.337 ms unswbr1-te-8-1.gw.unsw.edu.au (149.171.255.105) 1.223 ms unswbr1-te-7-1.gw.unsw.edu.au (149.171.255.101) 1.113 ms
 7 138.44.5.0 (138.44.5.0) 1.310 ms 1.350 ms 1.868 ms
 8 ae5.pe2.brwy.nsw.aarnet.net.au (113.197.15.55) 1.924 ms 1.866 ms 1.751 ms
 9 ae9.bb1.a.syd.aarnet.net.au (113.197.15.57) 1.883 ms 1.793 ms 1.856 ms
10 gigabitethernet1-1.pe1.b.syd.aarnet.net.au (202.158.202.18) 2.108 ms 2.035 ms 2.013 ms
11 gigabitethernet3-11.ken37.sydney.telstra.net (139.130.0.77) 2.700 ms 2.901 ms 2.961 ms
12 bundle-ether13.ken-core10.sydney.telstra.net (203.50.11.94) 3.190 ms 3.190 ms 3.109 ms
13 bundle-ether12.win-core10.melbourne.telstra.net (203.50.11.123) 15.397 ms 15.212 ms 15.190 ms
14 gigabitethernet5-0.exi-service2.melbourne.telstra.net (203.50.80.132) 13.260 ms 13.325 ms 13.329 ms
First observe that the 6th hop router is different for each of the 3 ping packets. This behaviour is not uncommon as packets on the Internet are routed independently of each other.
A general rule of thumb is that routes on the Internet do not need to be symmetric. For example, an administrative entity may choose to employ separate routers to handle ingoing and outgoing connections, to achieve better load balancing. Nevertheless, even when both the forward and the reverse path cross the same router, it is possible that different IP addresses are observed. For example, both paths cross a router named ae9.bb1.a.syd.aarnet.net.au; however, we observe different IP address in the two paths (Telstra to my machine: 113.197.15.56, my machine to Telstra: 113.197.15.57). The reason behind this is that the names we see in the traceroute output are the names of the router interfaces and not of routers. So, both IP addresses indeed belong to the same route but have been allocated to different interfaces of it. A similar conclusion can be made for the IP address 138.44.5.1 (Telstra to my machine) and 138.44.5.0 (my machine to Telstra). It is likely that this is the router that connects UNSW to the AARNET network.
IP address of my machine: 129.94.8.24, IP address of
www.speedtest.com.sg
: 202.150.221.170
traceroute from speedtest.com.sg to my machine:
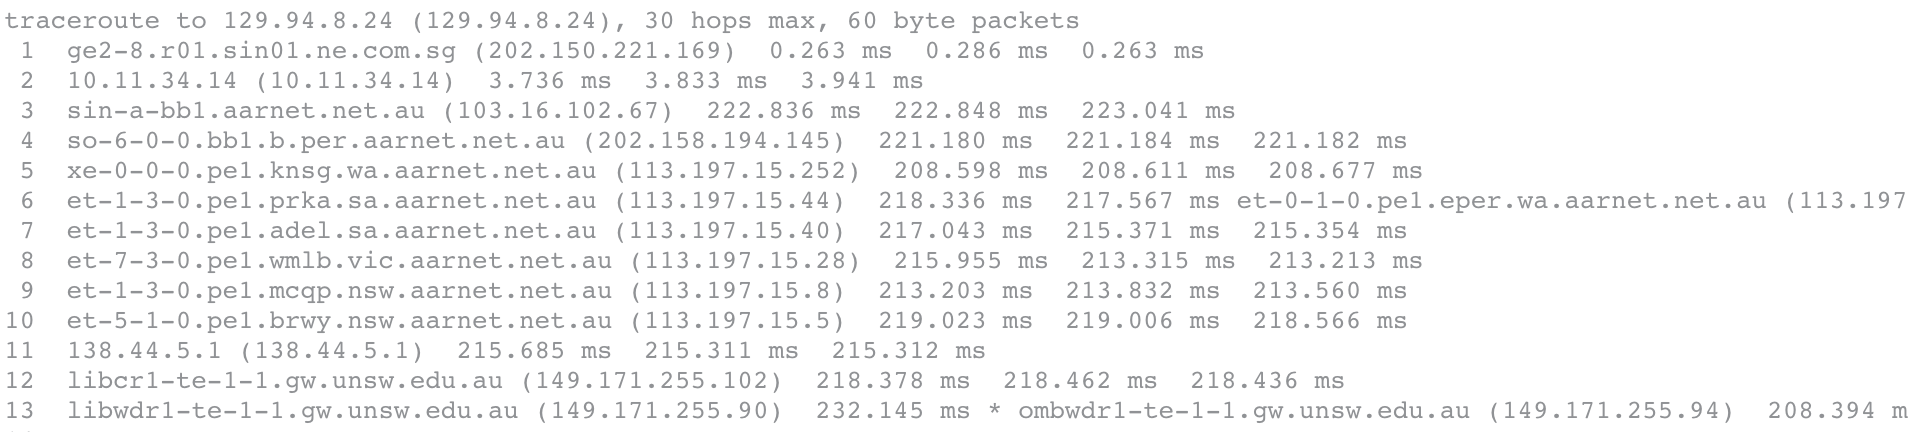
traceroute to www.speedtest.com.sg (202.150.221.172), 30 hops max, 40 byte packets
 1 vlan385.gaszr1.gw.unsw.EDU.AU (129.94.242.1) 1.519 ms 1.640 ms 1.850 ms
 2 129.94.6.122 (129.94.6.122) 0.495 ms 0.499 ms 0.491 ms
 3 129.94.39.17 (129.94.39.17) 1.230 ms 1.233 ms 1.225 ms
 4 ombudnex1-vl-3154.gw.unsw.edu.au (149.171.253.35) 2.202 ms libudnex1-vl-3154.gw.unsw.edu.au (149.171.253.34) 53.589 ms ombudnex1-vl-3154.gw.unsw.edu.au (149.171.253.35) 2.187 ms
 5 libcr1-po-5.gw.unsw.edu.au (149.171.255.165) 1.374 ms 1.368 ms ombcr1-po-6.gw.unsw.edu.au (149.171.255.169) 1.381 ms
 6 unswbr1-te-8-1.gw.unsw.edu.au (149.171.255.105) 1.428 ms 1.205 ms 1.208 ms
 7 138.44.5.0 (138.44.5.0) 1.312 ms 1.489 ms 1.387 ms
 8 et-1-1-0.pe1.rsby.nsw.aarnet.net.au (113.197.15.12) 1.826 ms 1.789 ms 1.769 ms
 9 ae5.pe1.msct.nsw.aarnet.net.au (113.197.15.63) 1.867 ms 1.808 ms 2.173 ms
10 xe-0-0-3.pe1.wnpa.akl.aarnet.net.au (113.197.15.67) 24.803 ms 24.850 ms 24.791 ms
11 et-0-1-0.200.pe1.tkpa.akl.aarnet.net.au (113.197.15.69) 26.921 ms 26.899 ms 26.803 ms
12 xe-1-0-0.bb1.a.lax.aarnet.net.au (202.158.194.173) 149.598 ms 149.572 ms 149.573 ms
13 singtel.as7473.any2ix.coresite.com (206.72.210.63) 176.602 ms 176.599 ms 176.591 ms
14 203.208.172.149 (203.208.172.149) 149.552 ms 203.208.172.189 (203.208.172.189) 149.523 ms 203.208.172.185 (203.208.172.185) 149.315 ms
15 203.208.183.146 (203.208.183.146) 149.691 ms 149.690 ms 149.665 ms
16 203.208.171.198 (203.208.171.198) 336.490 ms 203.208.151.98 (203.208.151.98) 311.742 ms 203.208.153.121 (203.208.153.121) 326.387 ms
17 203.208.171.201 (203.208.171.201) 321.598 ms 203.208.177.110 (203.208.177.110) 219.631 ms 219.628 ms
18 203.208.171.198 (203.208.171.198) 331.775 ms 326.992 ms *
In this instance, the forward and reverse paths appear to be very different. The path from my machine to speedtest.com.sg appears to go through routers in Auckland (113.197.15.69) and LA (202.158.194.173) whereas the path from speedtest.com.sg to my machine appears to pass through Western Australia (202.158.194.145), South Australia (113.197.15.44) and Victoria (113.197.15.28).
Observe the same router - 138.44.5.0/138.44.5.1 as in the previous example.
Exercise 4: Use ping to gain insights into network performance (4 marks)
Note: The hosting arrangements for www.dlsu.edu.ph have changed since the results below were compiled. You were asked to use www.upm.edu.my located in Serdang, Selangoor in its place. Your results will vary slightly from those shown for that domain. In general, the exact numbers will obviously vary but the relative values and general trend across the 3 locations should be similar.
Question 1.
Distance between Sydney and the 3 destinations (based on flight path between them) are:
Brisbane: 750km, Manila: 6260km, Berlin: 16,084.
Assuming propagation speed of 3 x 10^8 m/s, the shortest possible time that a packet will take to reach these 3 destinations are:
Brisbane: 2.5ms, Manila: 20.86ms, Berlin: 53.61ms
The minimum RTT (for 50 byte packets) to these 3 destinations from the corresponding *avg.txt files are:
Brisbane: 14.993ms, Manila: 177.5ms, Berlin: 346.893ms
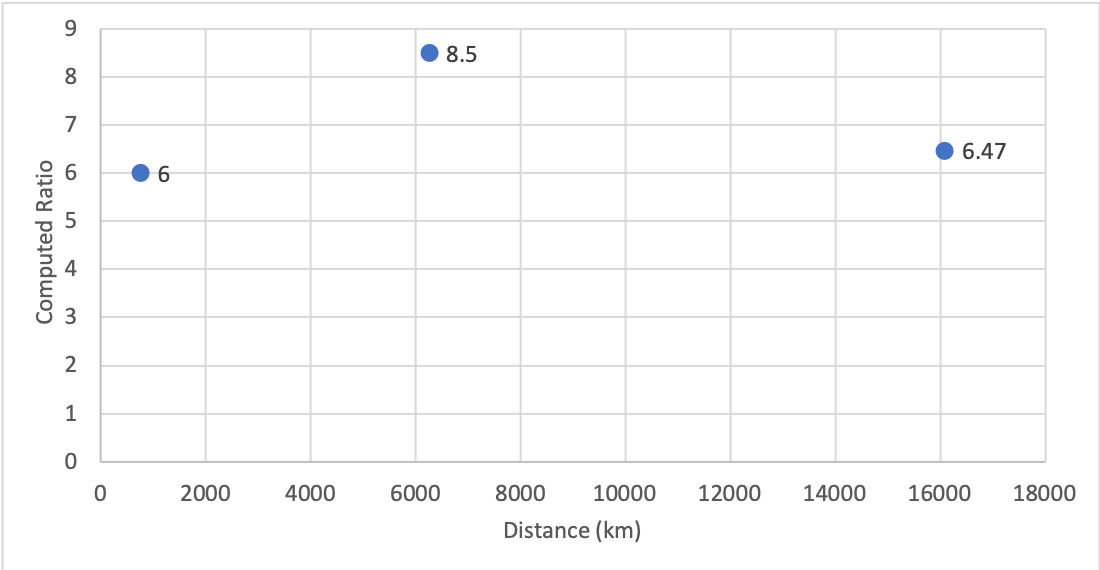
As such, the ratios of the minimum RTT to the minimum propagation delay for these 3 destinations are:
Brisbane: 6, Manila: 8.50, Berlin: 6.47
The following plot illustrates this ratio as a function of distance.
- packets travel along cables and across multiple hops, rather than 'as the crow flies', i.e. directly
- speed of light does not take into account for transmission delays, congestion/queueing delay
- ISP-level routing may lead to paths that are not necessarily the shortest hop paths
- packets don't travel at the full speed of light through any real medium
- packets may traverse low bandwidth links such that it takes considerably extra time for the full packet to transit the link.
Question 2.
Each of the following plots (destination_delay.pdf) depicts the delay of consecutive packets of same size (every line), for different packet sizes (six different lines):
www.uq.edu.au (notice the variations here - some packets experience very large delays)
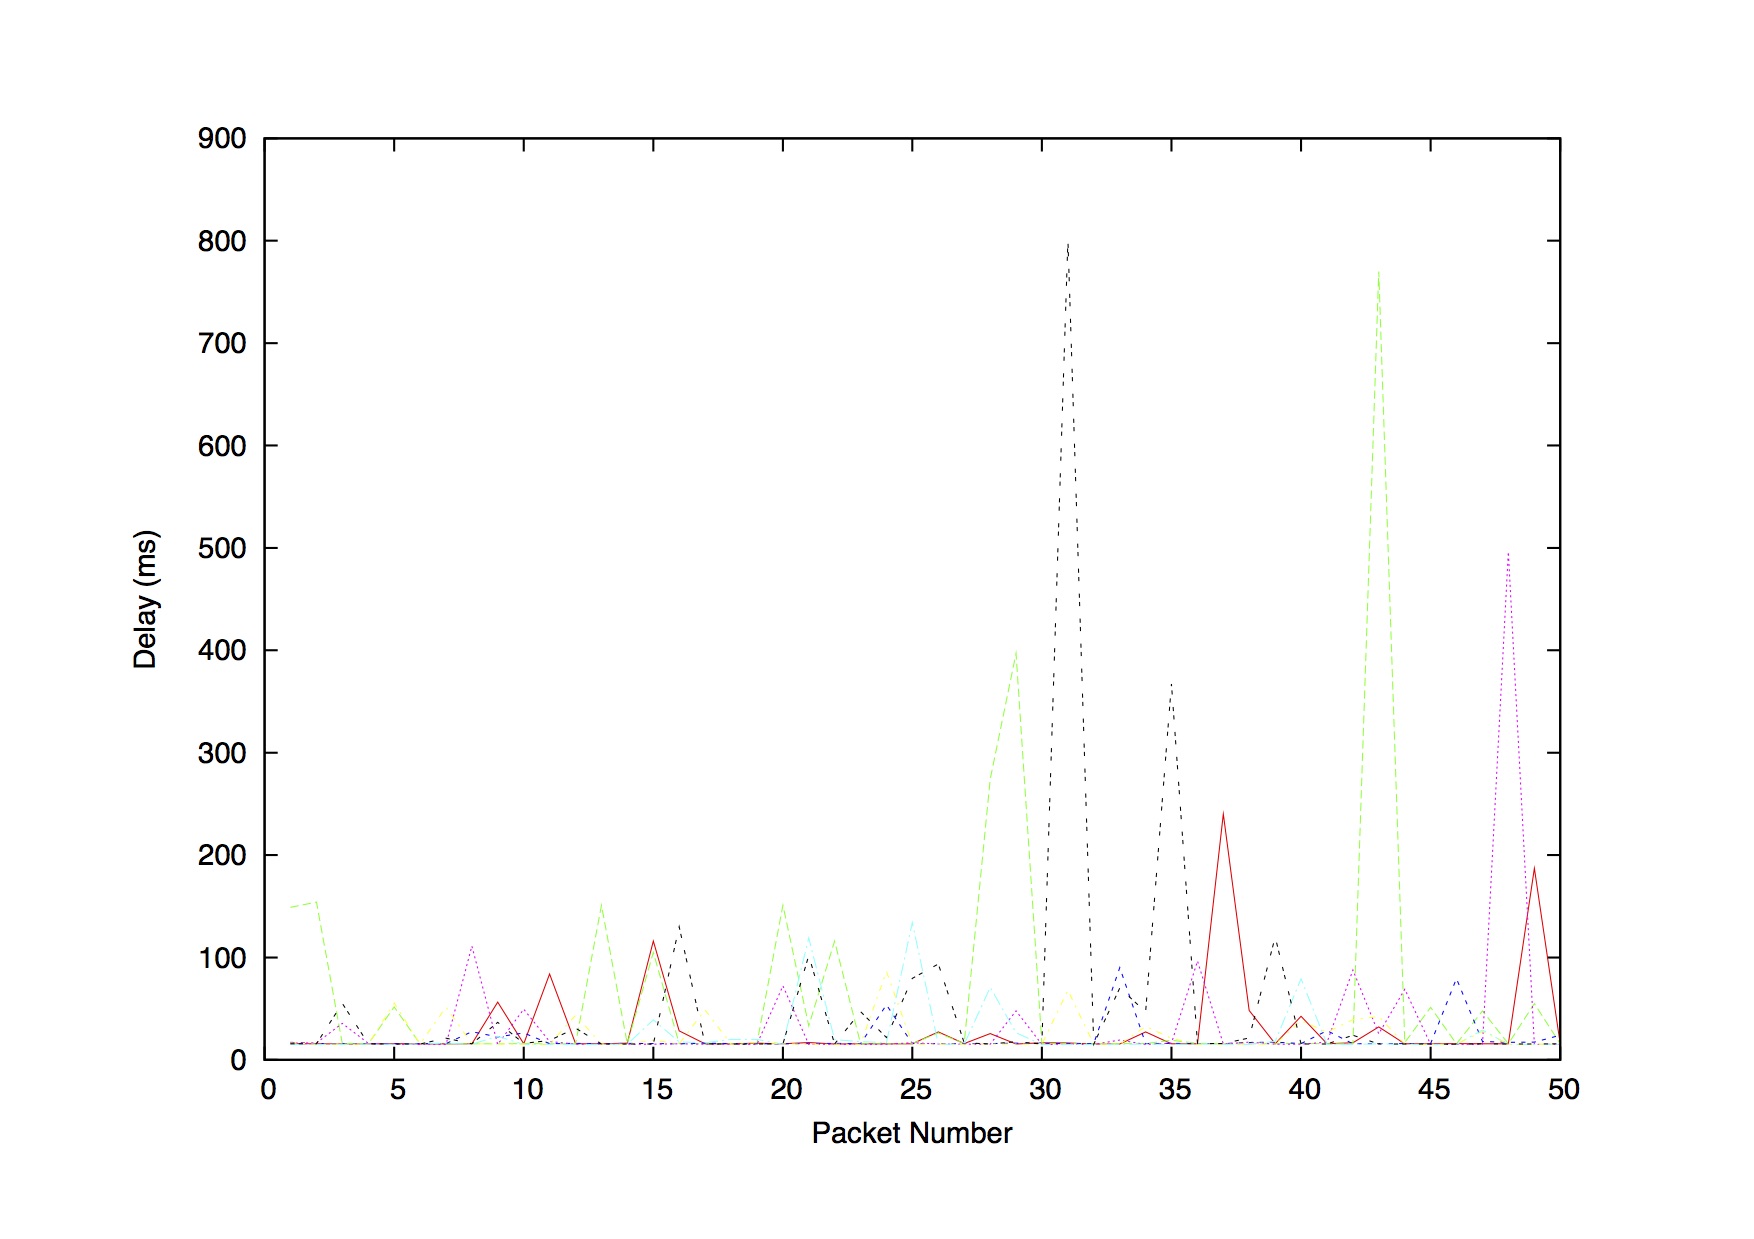
www.dlsu.edu.ph (notice the large variations here - some packets experience very large delays)
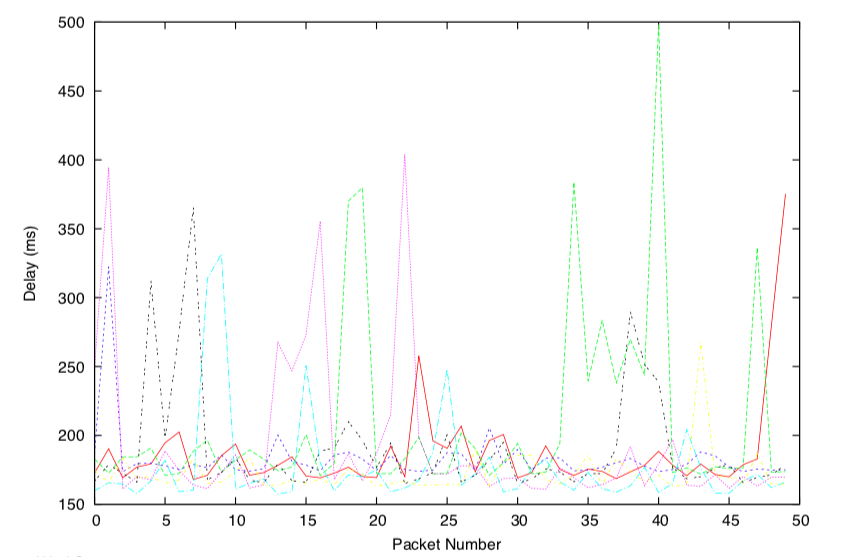
We can see from these plots that the delay randomly varies
over time. This is mostly due to the variability of processing
and queuing delays. The degree of variability is related to
the quality of the end-to-end path, and it does not
necessarily depend on the physical distance or even the number
of hops.
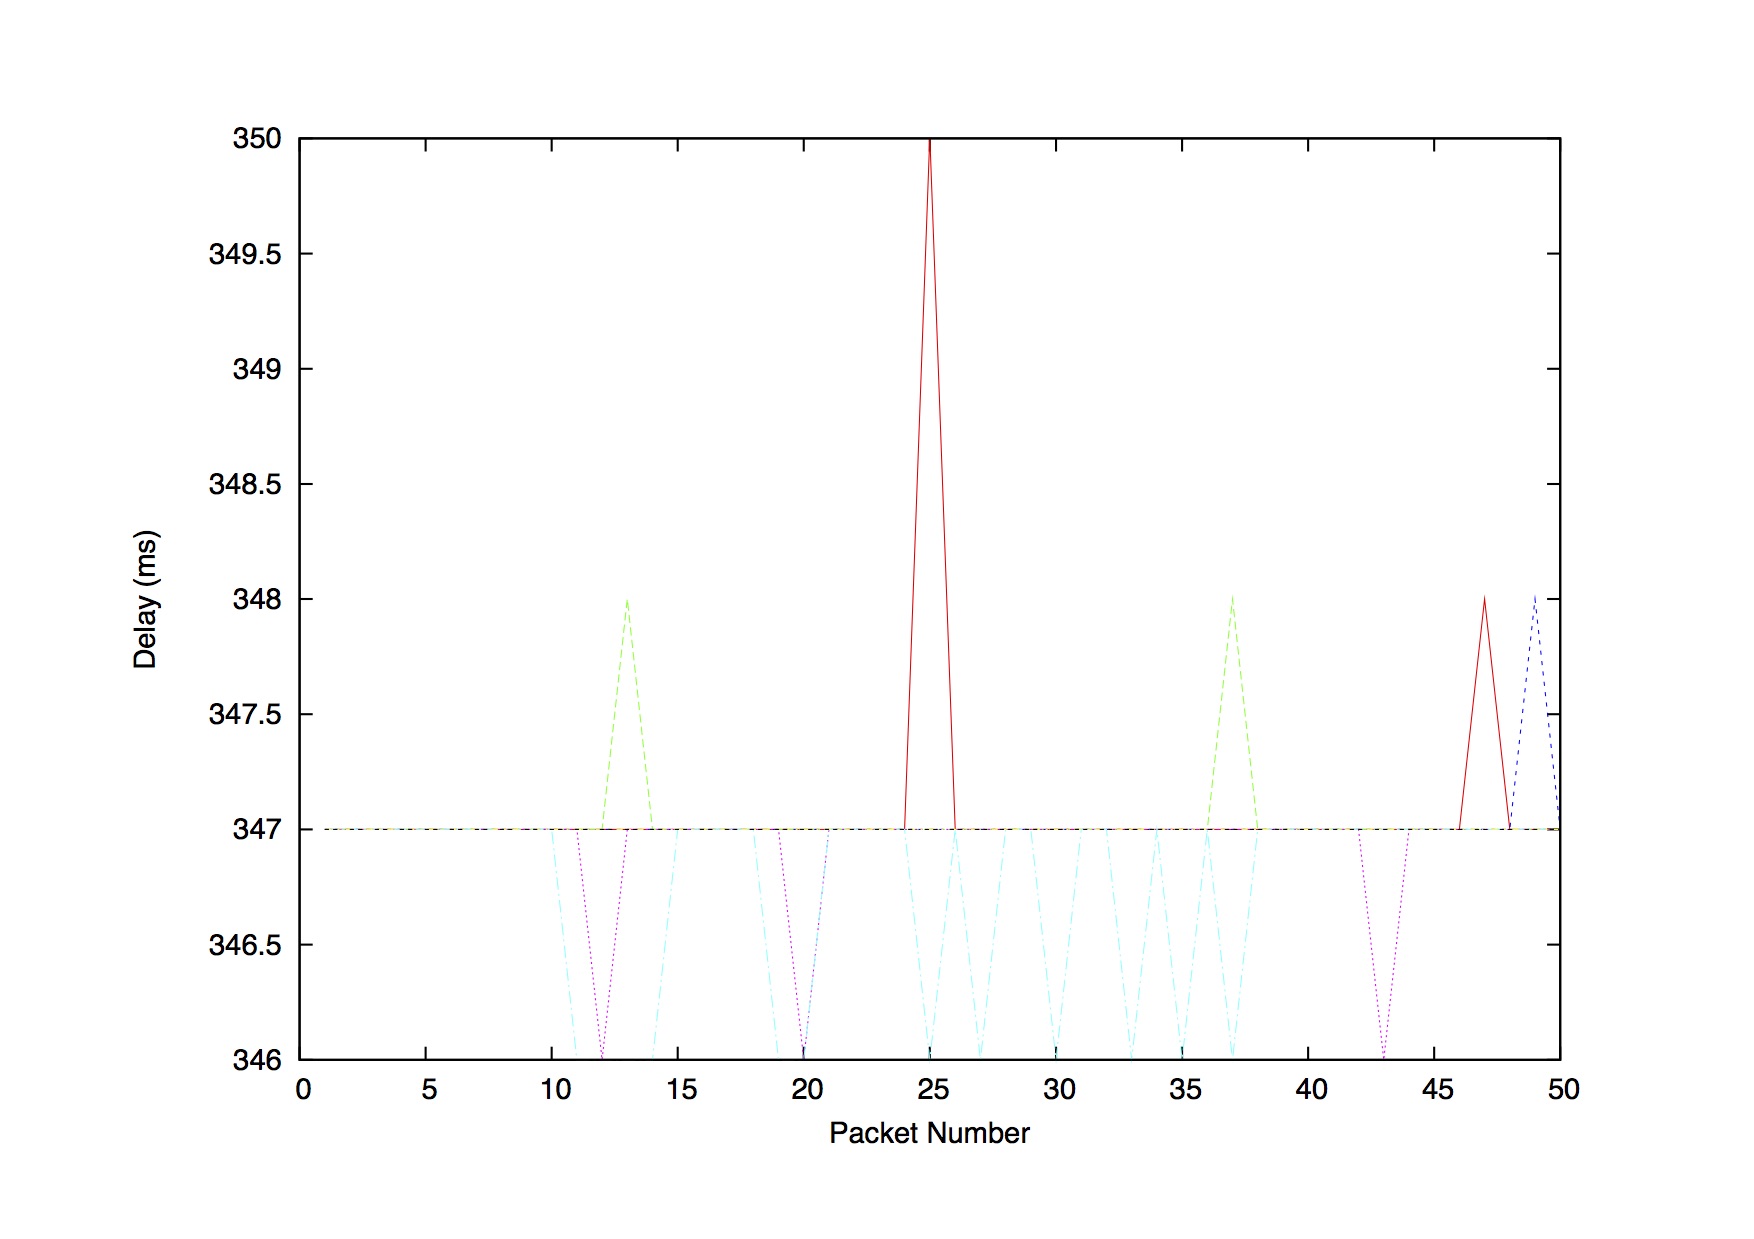
The following plots (destination_scatter.pdf) depict the various measurements of delay as a scatter plot for different packet sizes. The average delay for each packet size is also depicted.
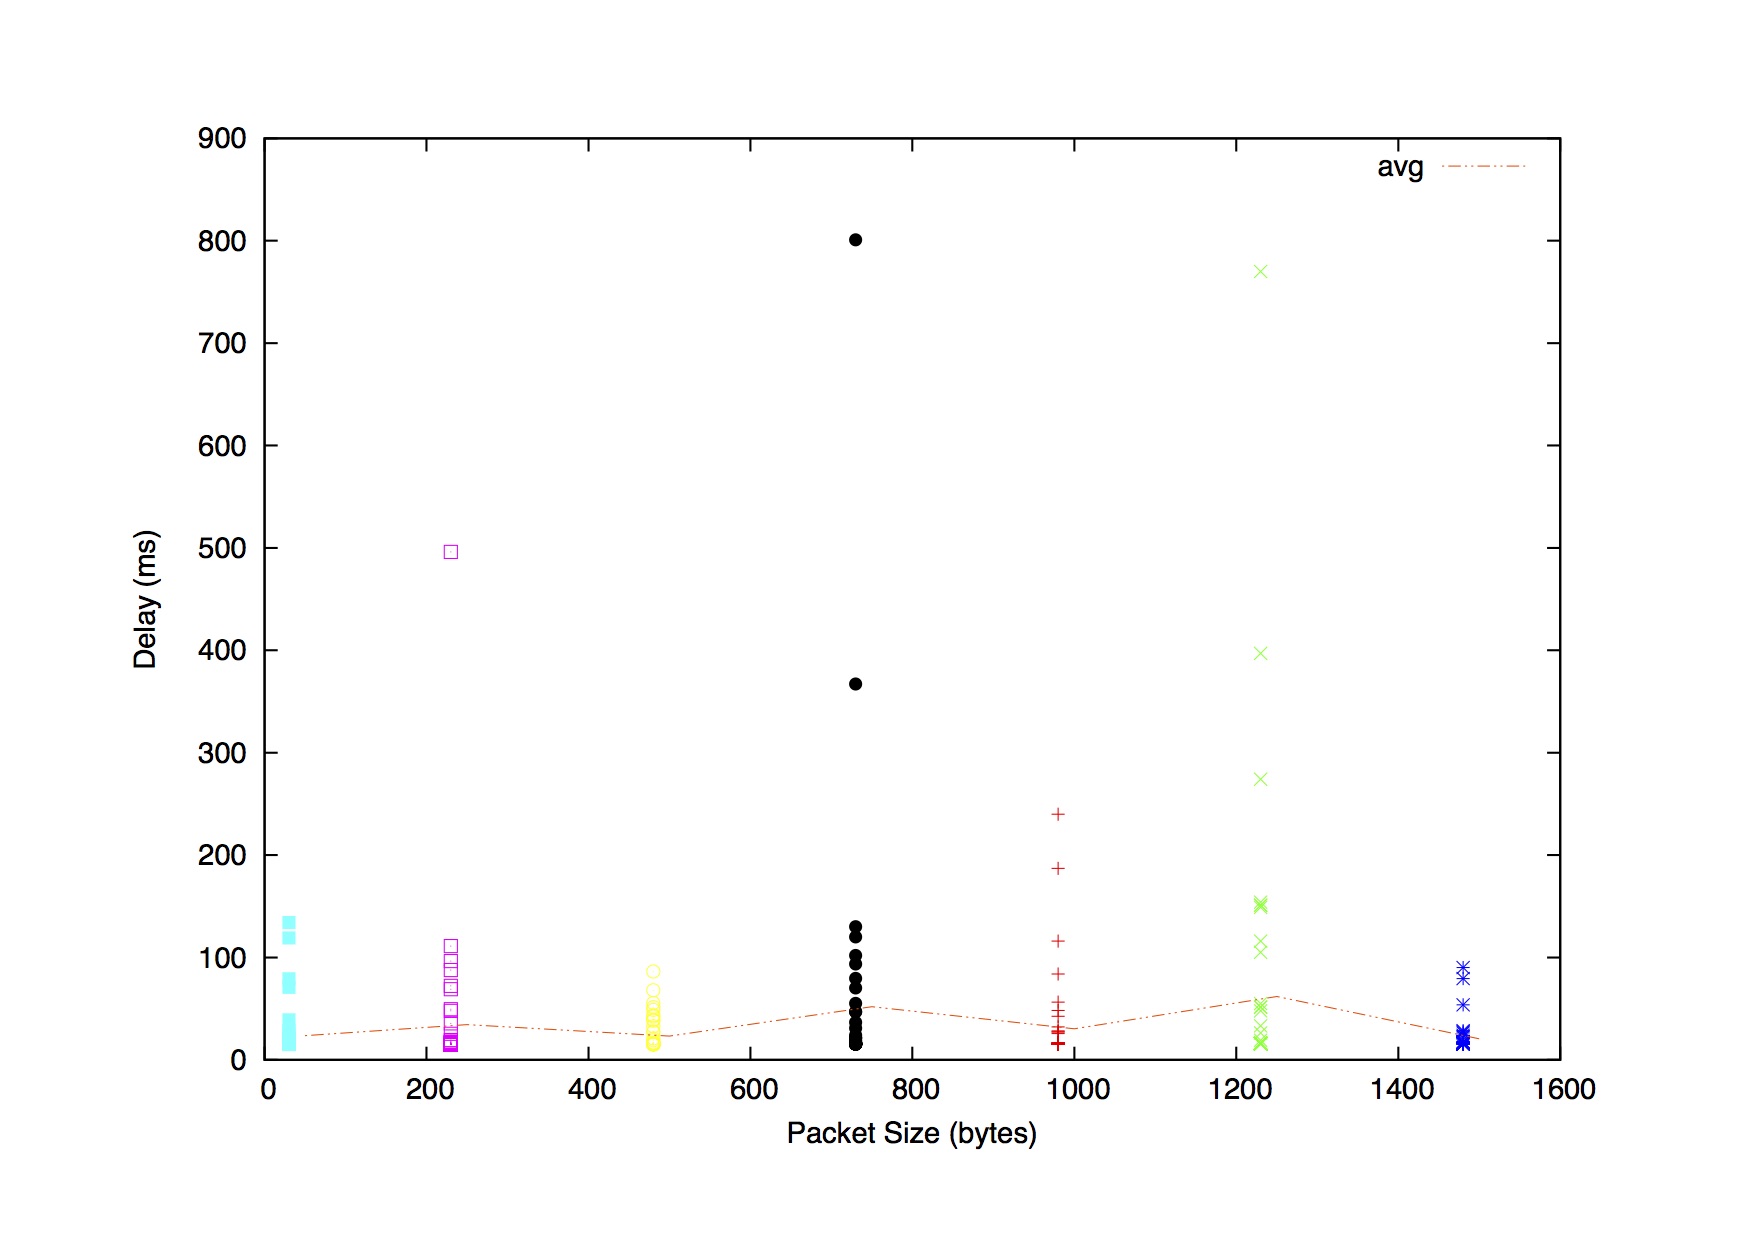
www.dlsu.edu.ph (the high variability is evident for this destination)
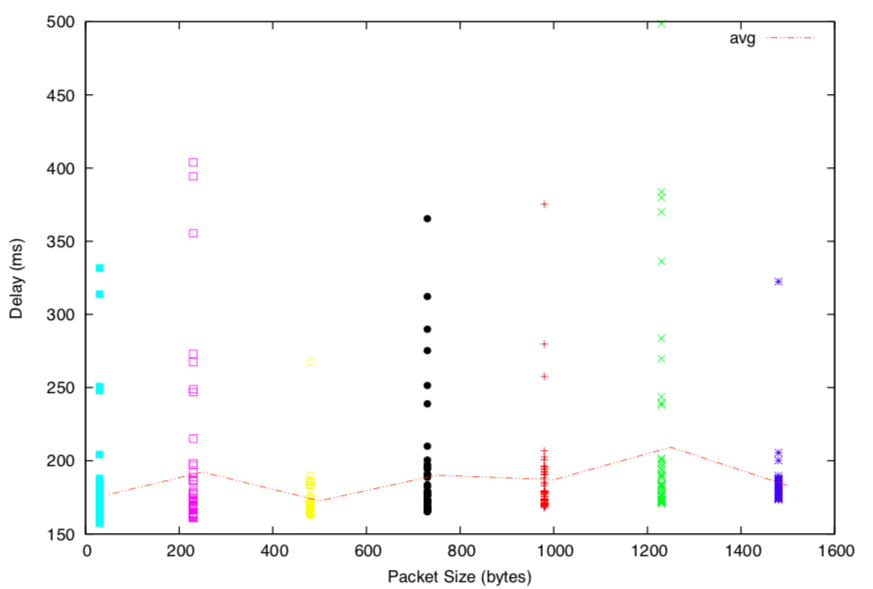
www.tu-berlin.de (the delay values I got for this destination were remarkably stable, I am keen to find out the experience of others).
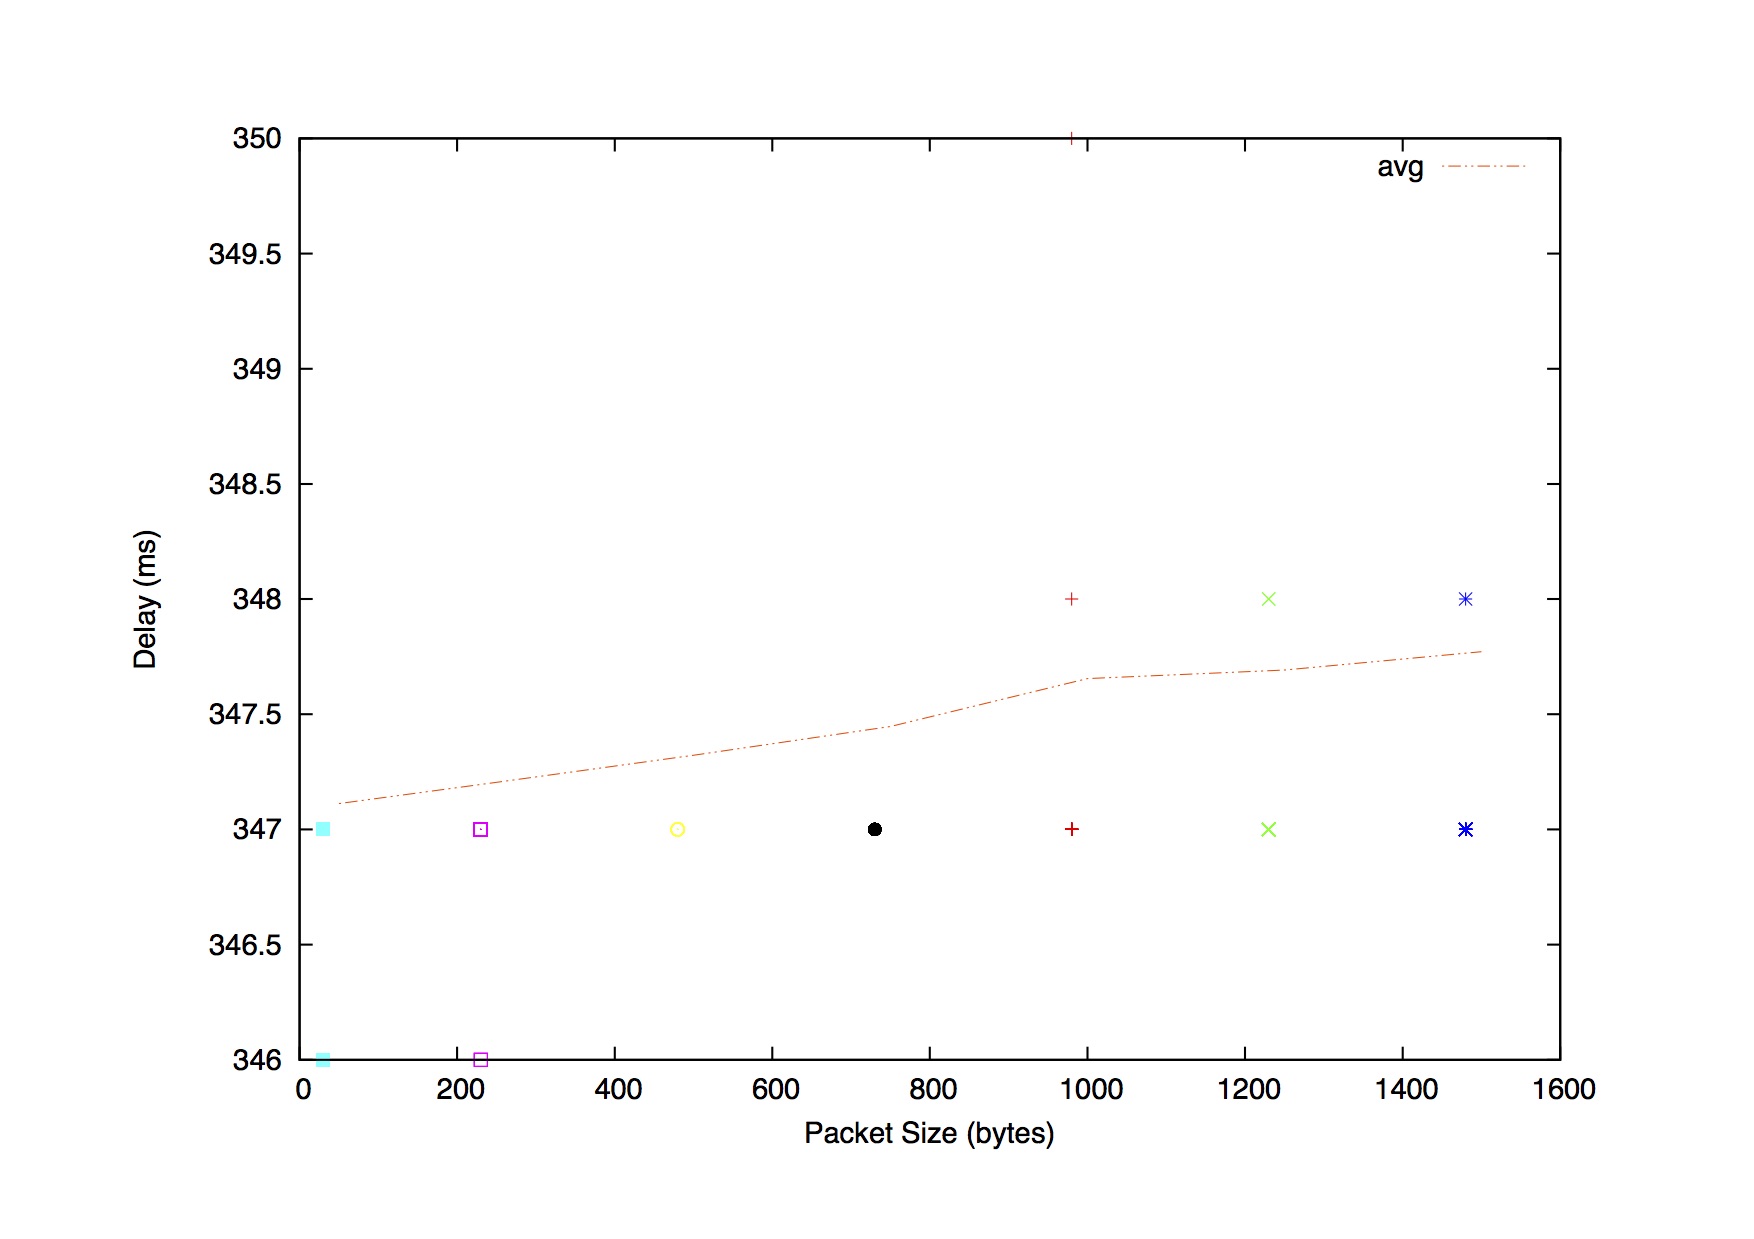
a) the destination is far away, and therefore the propagation
delay (independent from the packet size) is significantly
higher than the transmission delay (dependent on the packet
size)
b) there is high congestion in the network for "all" experiments, and therefore, the queueing delay (rather than the transmission delay) makes up a significant part of the total delay. High congestion for "all" experiments is rather unlikely to be seen since there is enough time passed between the experiments and the network conditions change each time, but we have added this explanation here for completeness.
Note that the first reason above may not be relevant for Brisbane but one could attribute the weak trend of the Berlin data (i.e. very marginal increase in delay as packet size increase) to this effect. The delay experienced by some of the ping packets sent to Brisbane and Manila are extremely high. These outliers may have distorted any inherent trend in the data.
Question 3.
The website is not hosted in Switzerland. This can be
confirmed from ping and traceroute. It is hosted in a CDN node
(
www.epfl.ch.cdn.cloudflare.net
) which is only 7-8 hops away from UNSW with RTT of about
36ms.
Question 4.
The propagation delay does not depend on the packet size. It's related to the link and, in general, does not vary (except if the link varies: cable, satellite, etc.)
The queuing delay only depends on the congestion in the network. It will increase with the amount of traffic on the network (the more traffic there is, the more our packets will wait to be processed at a router).
The transmission delay is almost proportional to the packet size; for a fixed packet size, it is constant.
The processing delay can depend on the packet size, but to a much smaller degree than transmission delay; for a fixed packet size, it is reasonably constant.
Resource created Saturday 04 September 2021, 10:47:43 AM, last modified Wednesday 06 October 2021, 09:00:47 AM.